US equity market ended little changed on Tuesday as the US economy grew more than expected last quarter. Weak consumer confidence and house price data kept major indexes in a narrow range. The Dow Jones industrial average fell 2.83 points or 0.02% to close at 17815.07, the S&P 500 lost 2.28 points or 0.11% to close at 2067.13 and the NASDAQ Composite added 3.36 points or 0.07% to close the day at 4758.25. Core durable goods, Employment claims and Home sales data are due on Wednesday, which might cause volatility in market with high volume.
Recommendation Buy above $72.55
Target $74.50
STOCK SUMMARY:-
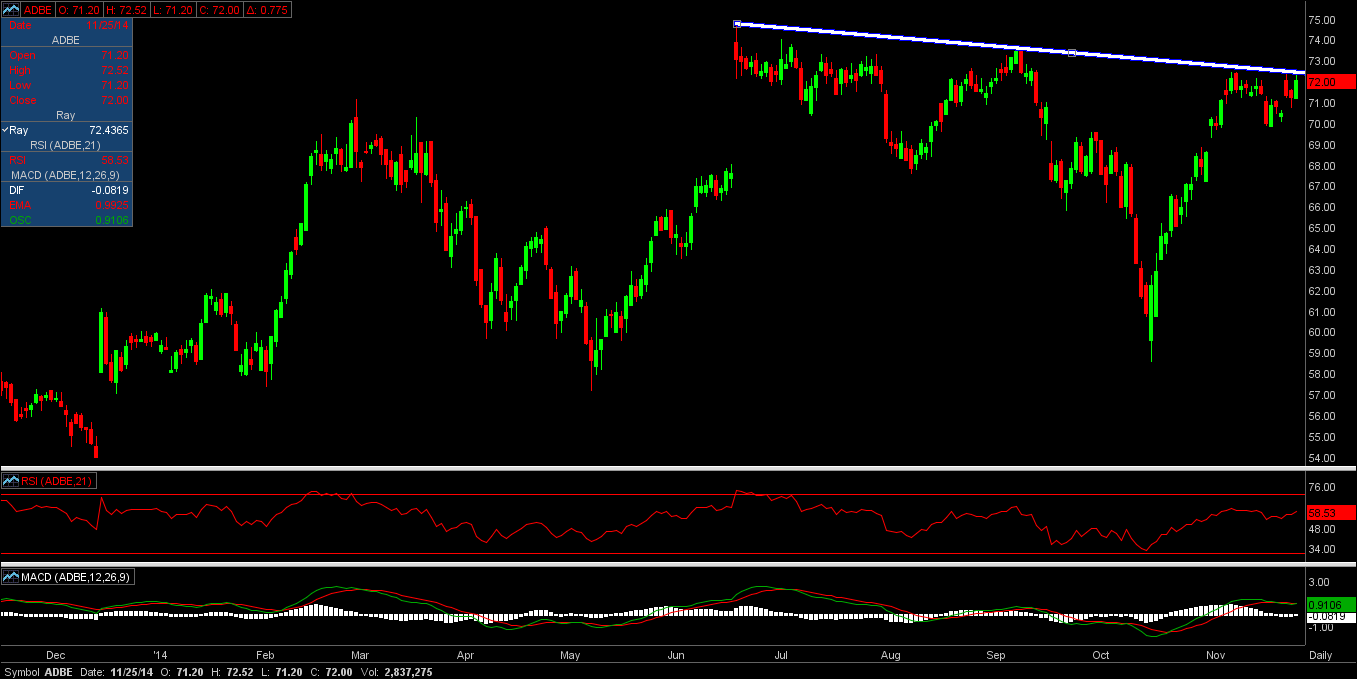
Adobe Sys Inc is overall in consolidate trend and is sustaining at higher levels on chart. Traders can buy the stock above the level of $72.55 which is a near term resistance level for the stock, and if it manages to breach this level further bullish movement is expected in this stock to test the levels of $74.50.
CHART FORMATION
Stock is in bullish trend for near term and price is sustaining below resistance trend line with bullish flag pattern formation on daily intraday chart. Near term breach of resistance level of $72.55 is expected, which would trigger further bullish sentiment in the stock to test the levels of $74.50.
INDICATORS:-
RSI is trading with positive bias and is sustaining above the level of 50.
In MACD, signal line is sustaining above MACD line which is indicating bullish sentiment in the stock.
Recommendation Buy above $72.55
Target $74.50
ADOBE
SYS INC
BULLS
OF THE STREET (NYSE)
|
Name
|
Close
Price ( $ )
|
Change
%
|
|
Dycon
Industries
|
30.04
|
14.66
|
|
Brown
Shoe
|
31.46
|
10.46
|
|
Eldorado
Gold
|
06.95
|
08.76
|
|
Build-A-Bear
Workshop
|
20.42
|
08.62
|
|
Douglas
Dynamics
|
24.79
|
08.30
|
BEARS
OF THE STREET (NYSE)
|
Name
|
Close
Price (
$ )
|
Change
%
|
|
Niska
Gas Storage Partners
|
05.34
|
11.74
|
|
Amira
Nature Foods
|
15.62
|
09.71
|
|
Arch
Coal
|
02.30
|
09.45
|
|
E-Commerce
China Dangdang ADS
|
11.27
|
09.23
|
|
Alpha
Natural Resources
|
02.21
|
09.22
|
STOCK SUMMARY:-
Adobe Sys Inc is overall in consolidate trend and is sustaining at higher levels on chart. Traders can buy the stock above the level of $72.55 which is a near term resistance level for the stock, and if it manages to breach this level further bullish movement is expected in this stock to test the levels of $74.50.
CHART FORMATION
Stock is in bullish trend for near term and price is sustaining below resistance trend line with bullish flag pattern formation on daily intraday chart. Near term breach of resistance level of $72.55 is expected, which would trigger further bullish sentiment in the stock to test the levels of $74.50.
INDICATORS:-
RSI is trading with positive bias and is sustaining above the level of 50.
In MACD, signal line is sustaining above MACD line which is indicating bullish sentiment in the stock.
- Activate Your Free Trial Now for #FOREX,#COMEX, #USA Stock Picks,#UK Stock Picks ,#HK Stock Picks.!!..Simply #Comment Your #Mobile Number and #E-Mail id Or Fill the Free trial Form Follow Link Here :-
No comments:
Post a Comment